
Investing
SIP vs Lumpsum: I Backtested 15 Years of NIFTY, and the Winner Surprised Me
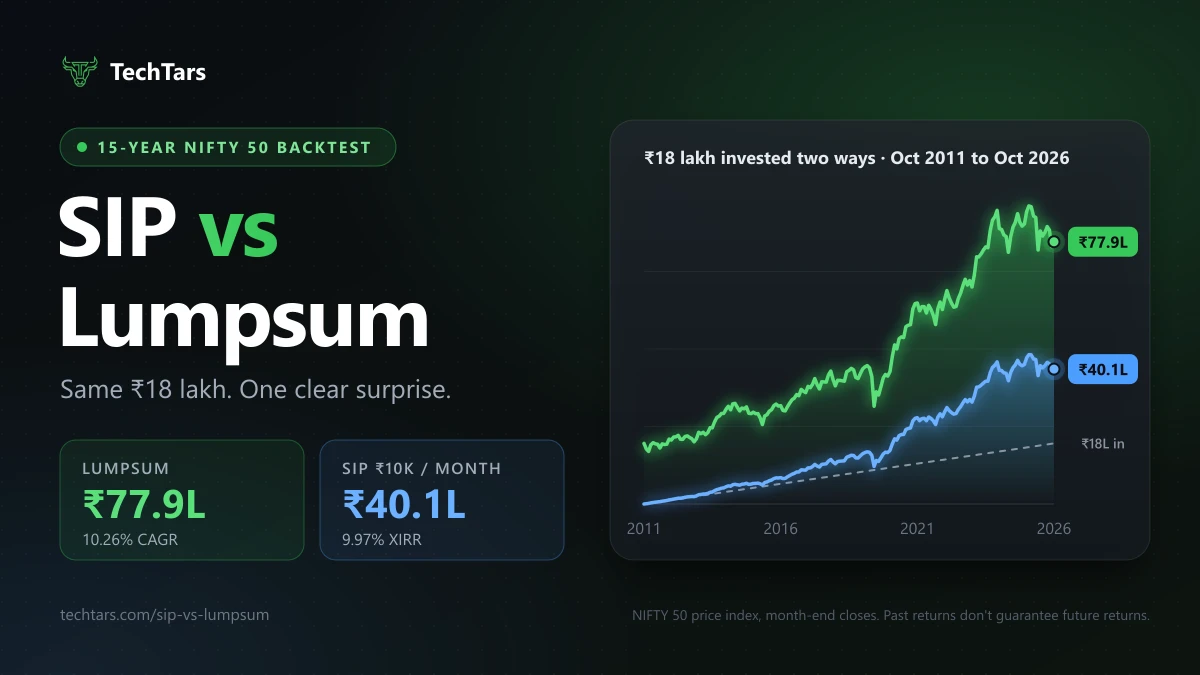
Quick answer: in my 15-year NIFTY 50 test, lumpsum made almost twice the money of a SIP. But the SIP gave a better yearly return most of the time. Both are true, and the reason is simple: the lumpsum had all its money in the market from day one, while the SIP added money slowly.
So the real question in SIP vs lumpsum is not "which is better?" It is "do you already have the money?" This article shows the real numbers in plain language and tells you which one fits your situation.
What SIP and lumpsum mean
- SIP: you invest a fixed amount every month. Example: ₹10,000 on the 5th of every month.
- Lumpsum: you invest a big amount in one go. Example: ₹12 lakh on one day.
- STP: a middle path. You keep your lumpsum in a safe liquid fund and move a part of it into the market every month.
A SIP buys more units when prices are low and fewer when prices are high. A lumpsum buys everything at one price, so the day you invest matters a lot.
How I tested it
I used the real month-end values of the NIFTY 50 index from September 2007 to October 2026 (source: Yahoo Finance). That is 19 years, and it includes the 2008 crash, the 2020 COVID crash and the fall after the November 2025 peak.
Instead of picking one start date, I tested every possible start month. This way, one lucky or unlucky date can't decide the result.
To keep it simple, I left out brokerage, fund charges, tax and dividends. Dividends would add roughly 1% to 1.5% a year to both methods, so the comparison stays fair.
Test 1: ₹10,000 a month vs ₹18 lakh on day one
Investor A starts a SIP of ₹10,000 a month. Investor B puts ₹18 lakh in on day one. Both invest the same ₹18 lakh in total. Here is where they stood after 15 years (October 2011 to October 2026):
| SIP | Lumpsum | |
|---|---|---|
| Total invested | ₹18 lakh | ₹18 lakh |
| Value in October 2026 | ₹40.1 lakh | ₹77.9 lakh |
| Yearly return | About 10.0% | About 10.3% |
The lumpsum made almost twice the money, but the yearly returns are nearly the same. Why? Time. The lumpsum's ₹18 lakh grew for the full 15 years. The SIP's money went in bit by bit, so on average each rupee grew for only about 7.5 years.
I then repeated this test for every start month since 2007:
| Period | Lumpsum made more money | SIP gave a better yearly return |
|---|---|---|
| 3 years | 90% of the time | 53% of the time |
| 5 years | 95% of the time | 61% of the time |
| 10 years | 98% of the time | 65% of the time |
| 15 years | 100% of the time | 80% of the time |
This surprised me. Over 15 years, the SIP gave the better yearly return in 40 out of 50 periods. In a typical 15-year period, the SIP earned about 11.9% a year and the lumpsum about 10.7%. Even in its worst 15-year period, the SIP earned 9.9% a year, while the lumpsum's worst was 7.5%.
One honest warning: all the 15-year periods in this data start between 2007 and 2011, close to the 2008 crash, when NIFTY fell 55%. A SIP does well when it starts before a crash because it keeps buying cheap. With calmer start years, the SIP's lead could be smaller.
Short SIPs can lose money
A SIP is not magic over short periods. If you started a ₹10,000 SIP in October 2023, you had put in ₹3.6 lakh by September 2026. In October 2026 it was worth only ₹3.51 lakh, a small loss. Most of your monthly buying happened when NIFTY was higher than where it ended (23,053), after falling from its November 2025 peak of 26,203.
Over 3 years, the worst SIP in the data lost about 14% a year. That is why equity is for money you won't need for at least 5 years.
Test 2: you already have ₹12 lakh. Invest all now or slowly?
This is the fair version of the question, because both investors have the same money on the same day. One invests all ₹12 lakh at once. The other keeps it in a liquid fund (earning 6% a year) and moves ₹1 lakh into NIFTY every month for 12 months.
| Period | Investing all at once made more money | Typical extra gain |
|---|---|---|
| 5 years | 63% of the time | About 3% |
| 10 years | 62% of the time | About 3% |
| 15 years | 50% of the time | Almost zero |
Investing all at once wins more often because markets go up more often than they go down. But the gain is small, around 3% of the final amount. In bad cases, though, it ended with about one-third less money than the slow method. In good cases, it ended with about half more. So when you start matters more than how you invest.
Here is what that means in rupees. Each row is ₹12 lakh, valued in October 2026:
| Started in | What was happening | All at once | Over 12 months |
|---|---|---|---|
| December 2007 | Just before the 2008 crash | ₹45.1 lakh | ₹65.6 lakh |
| September 2011 | Flat market | ₹56.0 lakh | ₹54.4 lakh |
| September 2016 | Steady rise | ₹32.1 lakh | ₹31.0 lakh |
| January 2020 | Just before the COVID crash | ₹23.1 lakh | ₹25.5 lakh |
| September 2021 | Near a market high | ₹15.7 lakh | ₹16.5 lakh |
Notice the pattern. When "all at once" wins, it wins by a little. When it loses, it can lose by a lot, like ₹20 lakh in the 2007 case. Still, even that unlucky investor's ₹12 lakh grew almost 4 times. The real danger of bad timing is getting scared and selling in the crash.
So, which one should you choose?
The real winner in my test was simple: invest your money as soon as you have it.
- You earn a monthly salary: choose SIP. Don't wait to collect a big amount first. Money sitting in a savings account doesn't grow much.
- You have a big amount now (bonus, FD maturity, property sale): investing it all at once usually does a bit better. If a big fall in the first year would make you panic, spread it over 6 to 12 months instead. You might give up around 1% to 3%, but you avoid the worst outcomes.
- You need the money within 5 years: choose neither. Keep it in safer options like an FD.
Common mistakes to avoid
- Looking only at the final amount. ₹77.9 lakh vs ₹40.1 lakh looks like a huge win for lumpsum, but the yearly returns were almost the same. Compare yearly returns, not just final amounts.
- Stopping your SIP when the market falls. A falling market is when your SIP buys the most units at low prices. Stopping then hurts your returns later.
- Waiting for a crash before investing. Nobody knows when the bottom is. While you wait, your money earns much less.
- Never increasing your SIP. Prices go up every year, so your SIP should too. Raising it by 10% every year means you invest ₹38.1 lakh over 15 years instead of ₹18 lakh. See the difference in the step-up SIP calculator.
Check your own numbers
This test shows what happened in the past, not what will happen next. To plan your own investment:
- SIP calculator: see how much your monthly SIP can grow.
- Lumpsum calculator: see how much a one-time investment can grow.
- How our SIP calculator works: the formula behind the numbers.
- NIFTY 50 today: where the index is right now.
New to investing? Read how to buy the NIFTY index and what a mutual fund is.
What this test doesn't cover
- It is based on one 19-year market history. The future can look different.
- It leaves out dividends, fund charges and tax. Note that money moved out of a liquid fund in an STP is taxed on its gains.
- A real index fund will trail the index slightly because of its charges.
- Past returns are no guarantee of future returns.
Bottom line
Lumpsum made more money because its money stayed in the market longer. SIP gave equal or better yearly returns and had a softer worst case. If you invest from your salary, start a SIP and increase it every year. If you already have a big amount, invest it soon, or spread it over 6 to 12 months if a sudden fall would make you quit.