Analyze any Indian or US stock in seconds - clear explanations, technical levels, and the news that moved it. No tips. No noise. Just structured intelligence.
Built by Yadav Patle · Transparent methodology · Educational, not investment advice
Latest guides
You don’t need a finance degree or lakhs of rupees to start investing in the stock market. If you’re a beginner in India, the biggest problem isn’t money,…

Want to Invest 5000 in Stock Market? Learn the best strategy, step-by-step process, and mistakes to avoid for beginners in India.
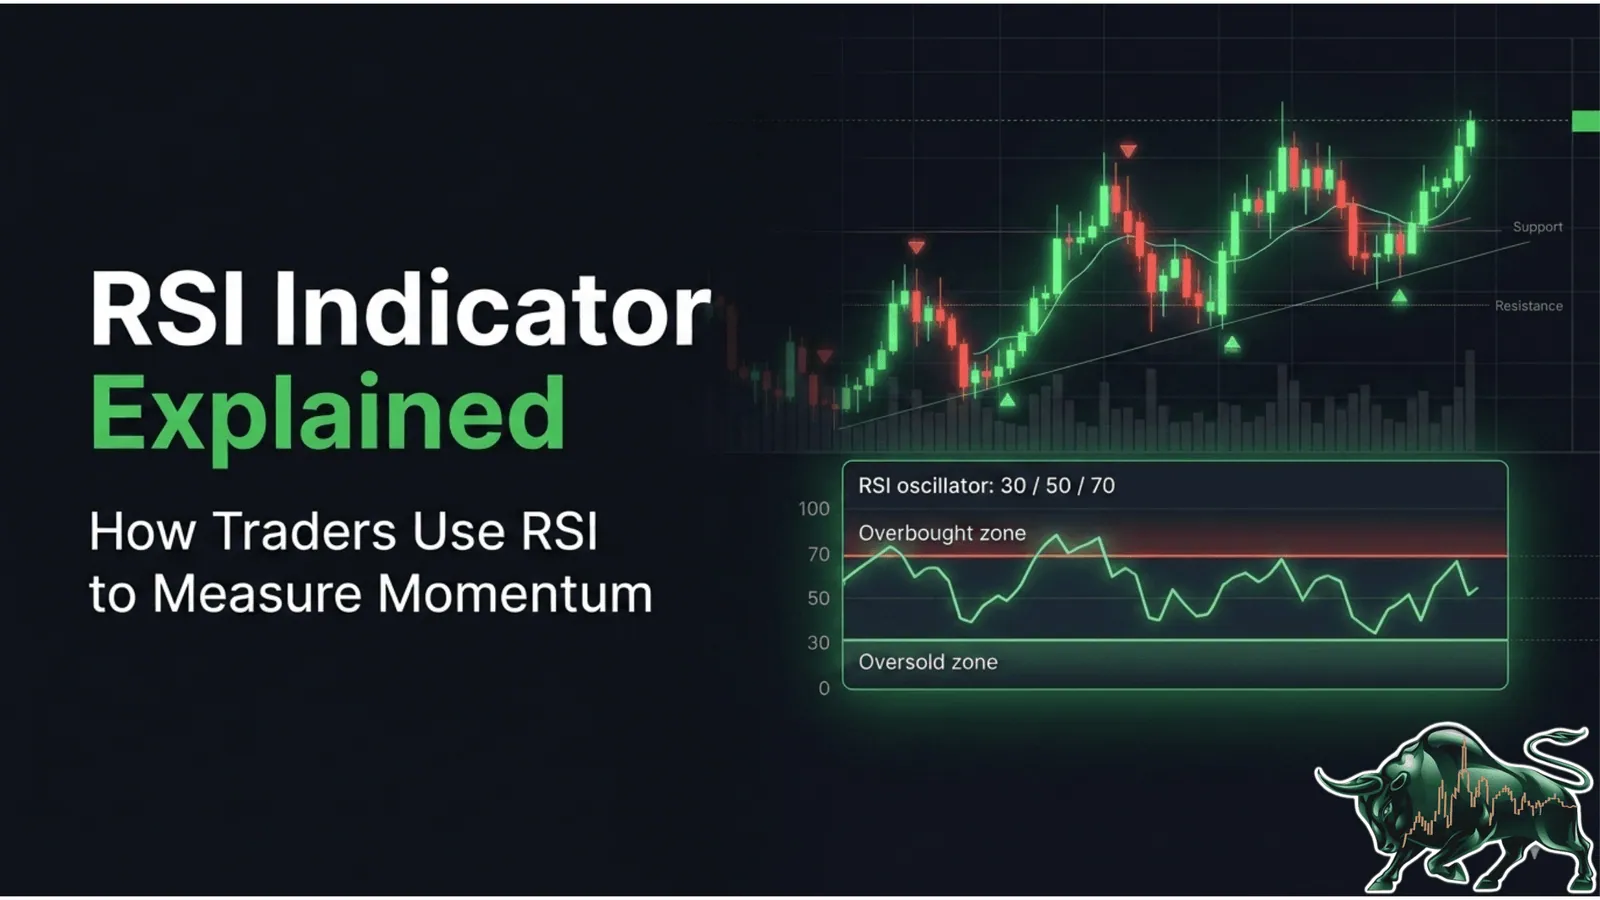
Learn what the RSI indicator is and how traders use the Relative Strength Index to identify overbought, oversold levels, and momentum in the stock market.
Clear stock explanations, transparent calculators, and beginner-friendly guides, built for real-world decisions.
TechTars explains the why behind a stock's daily move: the technical levels, the trend, and the news that drove it, in clear, jargon-free language. Browse Indian stocks (NSE & BSE) or US stocks, or read why the market indices moved.
Plan with transparent, methodology-backed estimates: SIP, EMI, PPF, FD, and all calculators. Every tool documents its formula on our methodology pages.
New to markets? Our investing guides cover mutual funds, IPOs, dividend investing, blue-chip stocks, and more, India-focused and beginner-friendly. Learn more about TechTars.
TechTars combines the day's price action, technical indicators (RSI, MACD, trend, and support/resistance) and the relevant news into a short, plain-language explanation of the primary driver behind the move.
Yes. You get five stock analyses without an account, then unlimited access for free after you sign in. There is no paid tier today.
Indian stocks (NSE and BSE) and US stocks, plus major market indices such as the Nifty, Sensex and S&P 500.
Yes. SIP, EMI, PPF, FD, lumpsum, net worth, forex position size and more are free, and each publishes its formula and assumptions on a methodology page.
No. TechTars is educational only and is not a SEBI-registered investment adviser or research analyst. Always consult a qualified adviser before investing.
TechTars provides structured, educational financial analysis for US and Indian markets. Nothing here is investment advice or a recommendation to buy or sell any security. Always consult a SEBI-registered adviser before investing.
Press Enter to get today's story
🔥 Most discussed today
Try 5 analyses free · No card required
Every stock you search returns a structured StockStory: the primary driver, the supporting signals, what to watch next, and the key levels. Here is a sample so you know exactly what you get.
TCS · NSE
Primary driver
Broad weakness across the IT sector after a pullback in global technology stocks and cautious commentary on discretionary tech spending.
Supporting signals
What to watch next
Support
₹3,850
Resistance
₹4,050
Figures shown are illustrative and for format demonstration only.
Search by ticker or company name. Understand why it moved - with price action, sentiment, and key levels.
Browse by sector
Trending Analyses
See two stocks head-to-head on today's price move, RSI, MACD, trend, support/resistance, and why each moved - using the same daily story contracts that power TechTars stock analysis.
Three simple steps from confusion to clarity.
Find any stock instantly or browse the top gainers/losers of the day.
Understand price action with AI-generated key levels and market sentiment.
Easily share insights or compare stocks side-by-side to act with confidence.
Free, accurate calculators to model every financial scenario before you commit.
Plan your systematic investments and see projected returns
Calculate loan EMIs for home, car, or personal loans
Estimate returns on one-time investment amounts
Project your Public Provident Fund maturity value
Calculate optimal position sizes for forex trades
Estimate maturity value of your fixed deposits
A calculator gives you a one-time number. TechTars Wealth turns it into a living, multi-asset net-worth tracker. Add your stocks, crypto, gold, cash, real estate and loans, get live market prices, and watch your true net worth grow over time.
Stocks, crypto, ETFs, gold, cash, real estate and loans in one true net-worth figure.
A daily snapshot builds a trend chart so you can see your wealth compound.
Real-time market valuation with FX-aware totals across Indian and US holdings.
Your holdings sync securely to your account — never indexed, never shared.
Market data sourced from established financial data providers and stock exchanges.
Every analysis shows its reasoning. No black-box recommendations or hidden agendas.
Designed to help you learn and understand -not to give buy/sell tips.
Analyze any Indian or US stock with TechTars StockStory.