Nifty 50 Year Wise Returns (2008 to 2026): Yearly Returns, CAGR and What They Mean for Your SIP
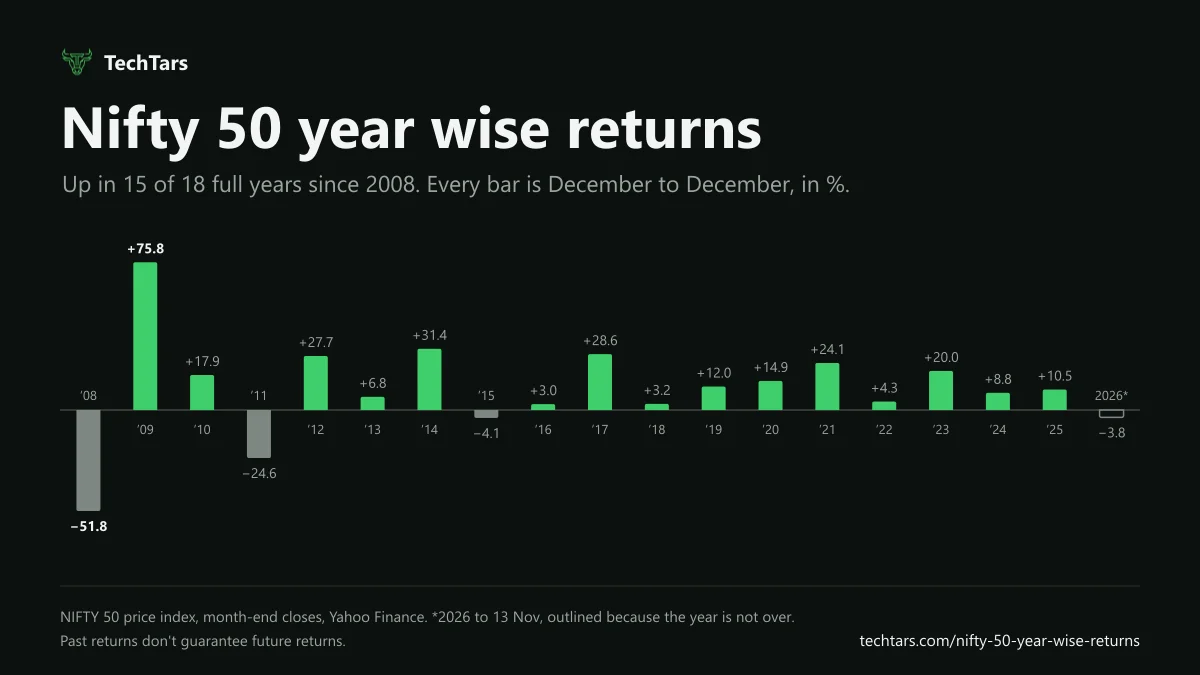
Quick answer: from 2008 to 2025, the Nifty 50 went up in 15 of 18 years. Its best year was 2009 (+75.8%) and its worst was 2008 (-51.8%). Over the last 10 years it grew about 11.7% a year, and over the last 15 years about 11.1% a year (to 13 November 2026). These are price returns. Dividends add roughly 1% to 1.5% a year on top.
Below are the Nifty 50 year wise returns, the returns for the last 1, 3, 5, 10 and 15 years, how much Nifty fell inside each year, and what the numbers mean if you invest through a SIP or a lumpsum.
Nifty 50 returns in the last 1, 3, 5, 10 and 15 years
These run up to the close on 13 November 2026 (25,144). CAGR is the growth rate per year that turns the start value into the end value.
| Period | Started at | Total return | CAGR (per year) | ₹1 lakh became |
|---|---|---|---|---|
| Last 1 year | 25,879 (13 Nov 2025) | -2.8% | -2.8% | ₹0.97 lakh |
| Last 3 years | 19,444 (13 Nov 2023) | +29.3% | 8.9% | ₹1.29 lakh |
| Last 5 years | 18,103 (12 Nov 2021) | +38.9% | 6.8% | ₹1.39 lakh |
| Last 10 years | 8,296 (11 Nov 2016) | +203.1% | 11.7% | ₹3.03 lakh |
| Last 15 years | 5,169 (11 Nov 2011) | +386.5% | 11.1% | ₹4.86 lakh |
The 5-year number looks weak because November 2021 was close to a market high. Measured from December 2020 instead, the 5-year CAGR was 13.3% (see the table further down). The start date matters as much as the length of the period.
Nifty 50 year wise returns (2008 to 2026)
Each return runs from the last close of one December to the last close of the next. The last column shows how far Nifty fell from its high at some point during that year, even in years that ended up.
| Year | Start | End | Return | Biggest fall during the year |
|---|---|---|---|---|
| 2008 | 6,139 | 2,959 | -51.8% | -64.6% |
| 2009 | 2,959 | 5,201 | +75.8% | -19.3% |
| 2010 | 5,201 | 6,135 | +17.9% | -12.0% |
| 2011 | 6,135 | 4,624 | -24.6% | -26.7% |
| 2012 | 4,624 | 5,905 | +27.7% | -15.3% |
| 2013 | 5,905 | 6,304 | +6.8% | -17.8% |
| 2014 | 6,304 | 8,283 | +31.4% | -7.6% |
| 2015 | 8,283 | 7,946 | -4.1% | -17.3% |
| 2016 | 7,946 | 8,186 | +3.0% | -14.1% |
| 2017 | 8,186 | 10,531 | +28.6% | -4.4% |
| 2018 | 10,531 | 10,863 | +3.2% | -14.9% |
| 2019 | 10,863 | 12,168 | +12.0% | -12.1% |
| 2020 | 12,168 | 13,982 | +14.9% | -39.6% |
| 2021 | 13,982 | 17,354 | +24.1% | -11.8% |
| 2022 | 17,354 | 18,105 | +4.3% | -17.3% |
| 2023 | 18,105 | 21,731 | +20.0% | -7.8% |
| 2024 | 21,731 | 23,645 | +8.8% | -11.5% |
| 2025 | 23,645 | 26,130 | +10.5% | -10.2% |
| 2026* | 26,130 | 25,144 | -3.8% | -15.9% |
* 2026 is up to 13 November 2026.
Source: NIFTY 50 month-end values from Yahoo Finance. You can check the year-end closes in NSE Indices' historical data. The "biggest fall" column uses monthly highs and lows, so the real fall inside a month was sometimes a little bigger.
Nifty 50 CAGR from December to December: 5, 10, 15 and 18 years
Single years jump around a lot. Longer periods are steadier. Here is the yearly growth rate (CAGR) measured from December to December, up to December 2025:
| Period | From | Growth per year | ₹1 lakh became |
|---|---|---|---|
| 5 years | December 2020 | 13.3% | ₹1.87 lakh |
| 10 years | December 2015 | 12.6% | ₹3.29 lakh |
| 15 years | December 2010 | 10.1% | ₹4.26 lakh |
| 18 years | December 2007 | 8.4% | ₹4.26 lakh |
The 15-year and 18-year rows end at the same ₹4.26 lakh. That is because Nifty closed December 2010 almost exactly where it closed December 2007 (6,135 vs 6,139). Someone who invested at the end of 2007 waited three years and had nothing to show for it.
Your start date changes the answer a lot. I checked every 5-year and 10-year period that starts in a December from 2007 onward:
- 5-year periods: only 1 of 14 lost money: December 2007 to December 2012, at -0.8% a year. The best was December 2008 to December 2013, at 16.3% a year.
- 10-year periods: the lowest was 5.5% a year (2007 to 2017) and the highest was 14.1% a year (2011 to 2021).
What this means for an investor
Nifty went up in most years, but almost never in a straight line. These are the four things I take from the table.
1. Expect a 10% fall almost every year
In 15 of the 18 years, Nifty fell 10% or more from a high at some point. In 2020 it fell about 40% by March and still ended the year up 14.9%. Even 2009, the best year, had a 19% drop along the way.
So a fall is normal, not a signal. If a 10% drop would make you sell, the money is probably in the wrong place. Money you need within 5 years is safer in options like an FD.
2. The average return hides the bad years
If you add up the 18 yearly returns and divide by 18, you get 11.6%. But the money actually grew 8.4% a year over the same 18 years. The gap comes from big losses. A 51.8% fall needs a 107% rise just to get back to where you were.
Look at 2008 and 2009. The average of -51.8% and +75.8% is +12%. Yet at the end of 2009, Nifty (5,201) was still 15% below the end of 2007 (6,139). When a calculator asks for an expected return, use a long-period growth rate like 10% to 12%, not the simple average.
3. Bad timing hurts a lumpsum more than a SIP
Take the unluckiest start in this data: the end of 2007, right before the crash.
- Lumpsum in December 2007: it grew 8.4% a year to December 2025. But Nifty only closed a month above its December 2007 level again in October 2013, almost six years later.
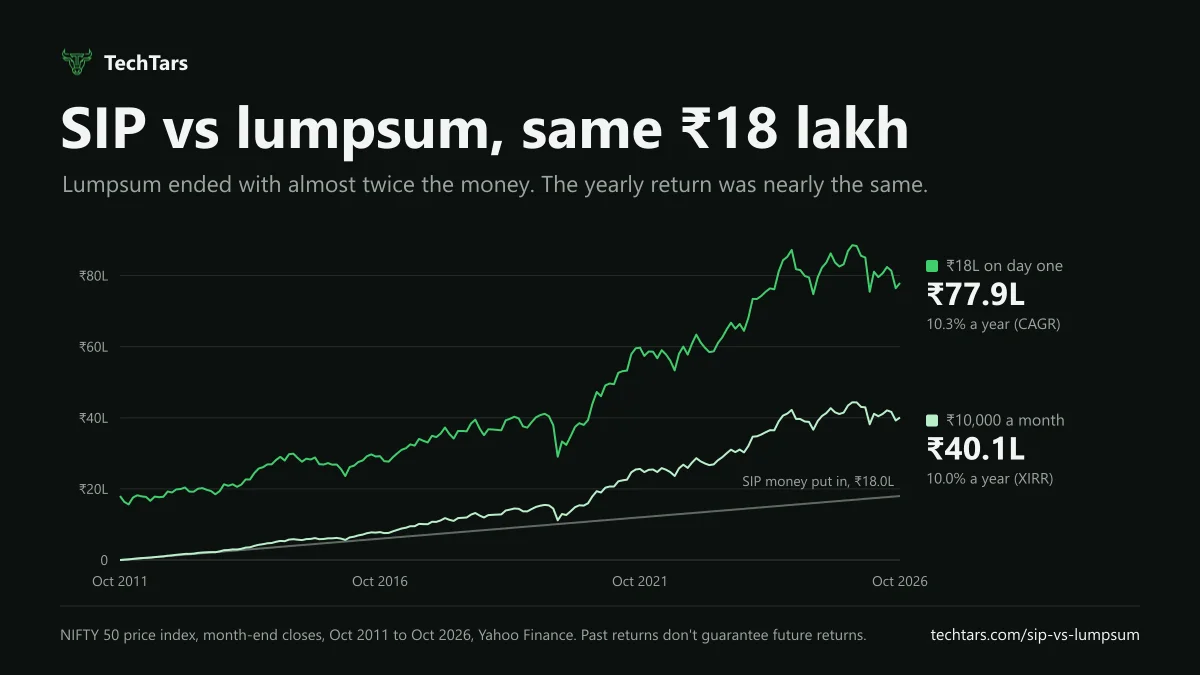
- ₹10,000 SIP every month from January 2008 to December 2025: ₹21.6 lakh invested became about ₹70.3 lakh. That is a yearly return (XIRR) of about 12.0%, because the SIP kept buying through the 2008 and 2011 falls.
This is the worst case for a lumpsum, so it is not the whole story. When you already have the money, investing it at once usually ends with more rupees. My SIP vs lumpsum backtest tests every start month and shows both sides.
4. Good years often came after bad ones, but not always
Nifty had three down years: 2008, 2011 and 2015. The year after each one, it returned +75.8%, +27.7% and +3.0%. Three cases are too few to make a rule, and 2016 shows the next year can be flat. Staying invested through the fall mattered more than guessing the bounce.
Check your own numbers
This table shows what happened, not what will happen next. To plan your own investment:
- SIP calculator: try 10% and 12% as the expected return, then 8% as a bad-start case. Turn on the inflation option to see the result in today's money.
- Lumpsum calculator: calculate Nifty 50 returns on your own amount, using the 10 and 15-year rates above.
- Step-up SIP calculator: see what raising your SIP every year does.
- SIP vs lumpsum: the full NIFTY 50 backtest for every start month.
- NIFTY 50 today: where the index is right now.
New to index investing? Read how to buy the Nifty index.
What this data doesn't cover
- Dividends: these are price returns. NSE's Nifty 50 Total Return Index (TRI) includes dividends and runs roughly 1% to 1.5% a year higher.
- Fund costs: a real index fund trails the index a little because of its fees and tracking error.
- Tax and inflation: all numbers are before tax and before inflation.
- Earlier years: the table starts in 2008 because that is where the monthly data used here begins. NSE has index data going back to the 1990s.
- Past returns are no guarantee of future returns.
Bottom line
Since 2008, the Nifty 50 rose in 15 of 18 years and grew about 11% to 12% a year over the last 10 to 15 years. Most years also had a fall of 10% or more along the way. Use 10% to 12% for planning, test a lower case, and keep money you need soon out of equity.